Does that mean that 60% of the buses in that peak hour go via Captain Cook Bridge? Or are there other directions they can go?
My brain knows thats 60 is the inverse of 40, but it can’t reconcile that many buses are going that way.
Does that mean that 60% of the buses in that peak hour go via Captain Cook Bridge? Or are there other directions they can go?
My brain knows thats 60 is the inverse of 40, but it can’t reconcile that many buses are going that way.
About half the buses use Captain Cook Bridge in the peak. There is a high reliance on rocket buses in Brisbane, with most rockets going into Riverside/Eagle street. The area is not easy to access with regular all-day bus routes.
For this reason, converting the SEB to LRT is likely to have high and negative impact on these peak hour workers as you’d no longer be able to run rockets into Eagle St/Riverside and you’d also impose a slower trip by forcing travel via Cultural Centre.
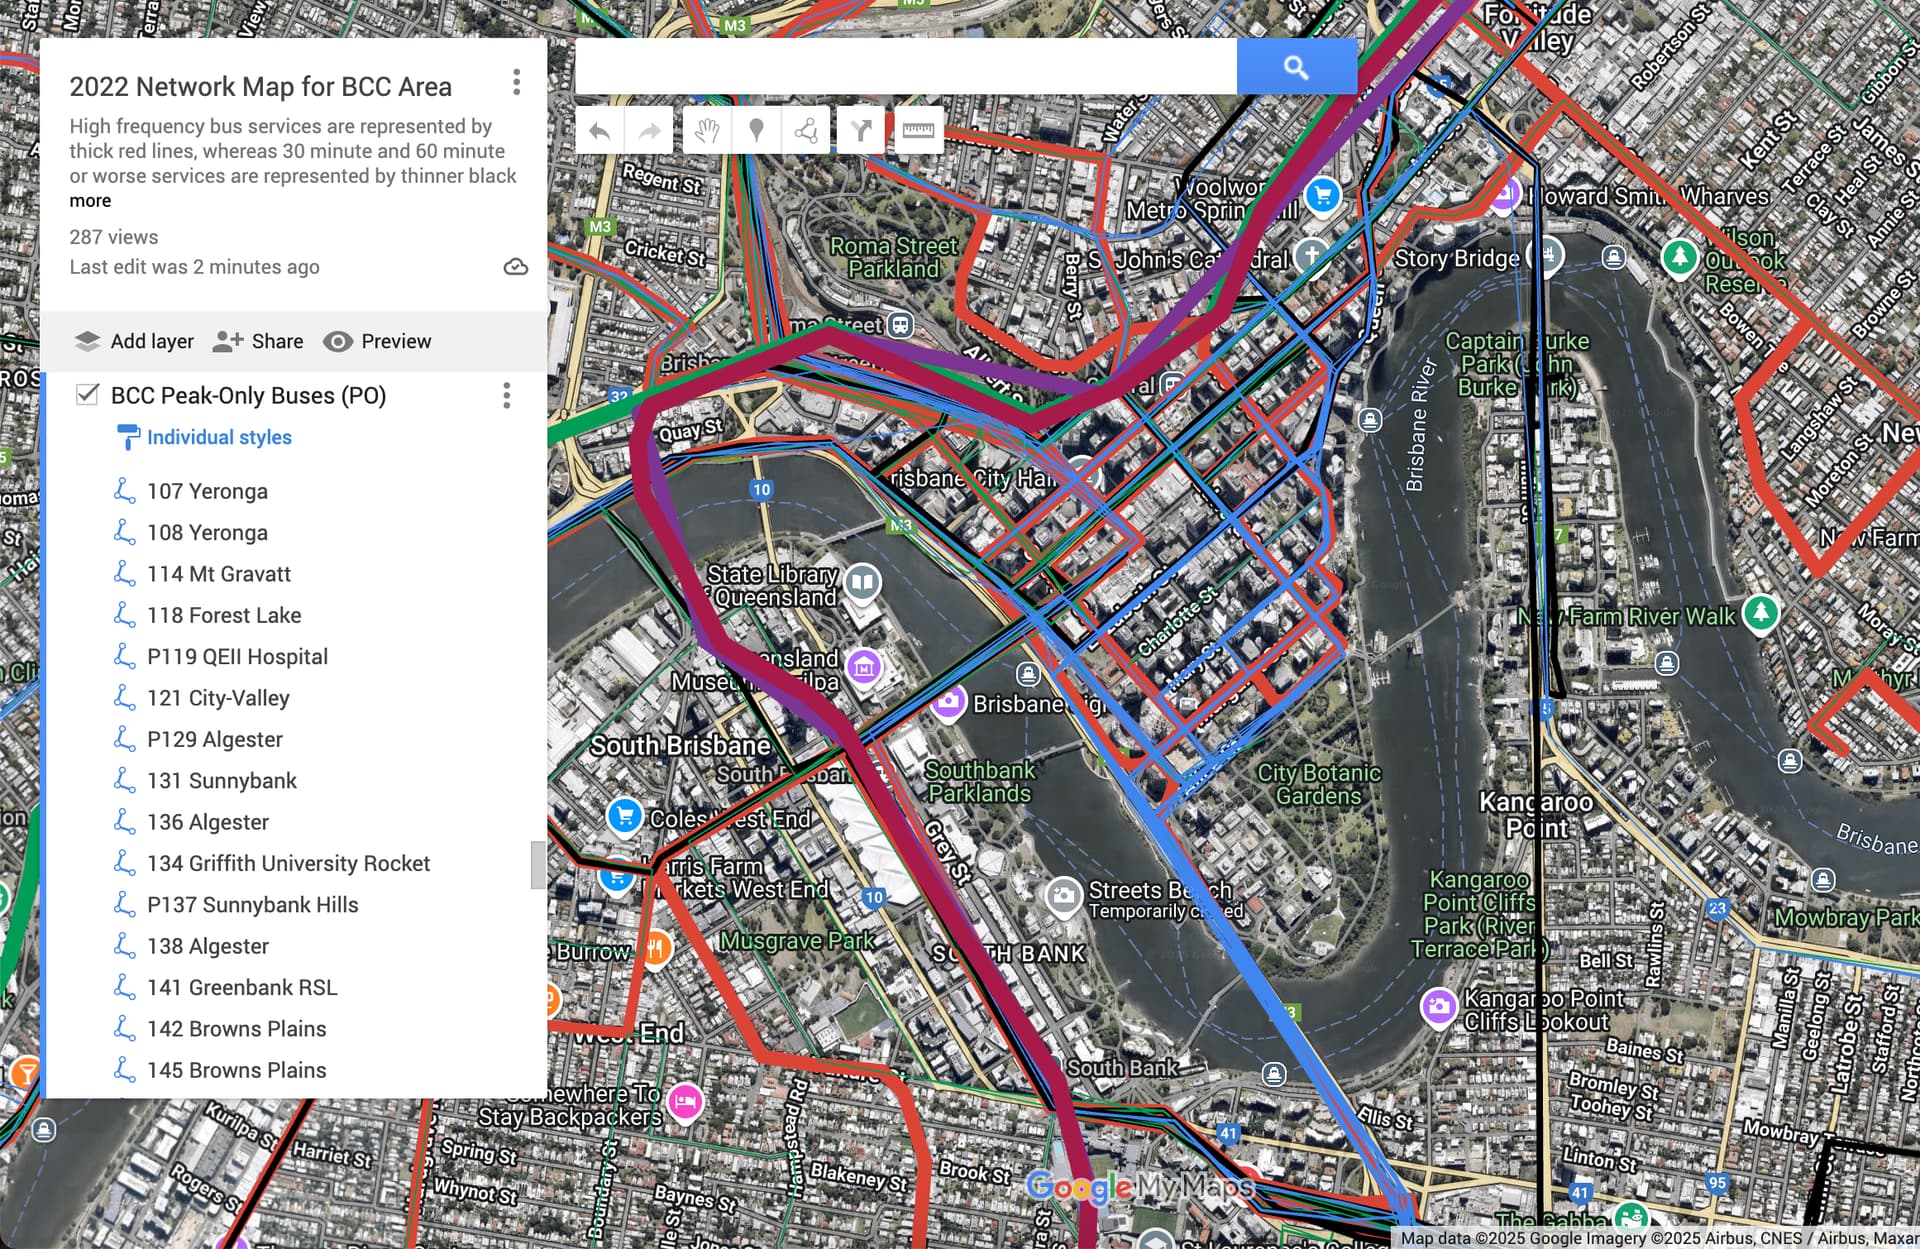
Update - Image
Brisbane City Council Bus Network (2022) showing the very high volume of Peak Only (PO) buses (including rockets) that use the Captain Cook Bridge [blue lines].
Most rockets are originating from the Southside and Western Suburbs.
Damn that’s a lot of Bertie Beetle Buses needed for one line in one direction. Roughly around 6x the current number of vehicles; double that for the both directions!
For M1 & M2 to hit 18k/hour/direction would require 12x the amount of Bertie Beetle buses than currently in operation. Running normal or banana buses does not count, neither do other services that happen to show up at the station. We are talking about the raw and absolute number of the highest capacity buses currently available to satisfy 18k/hour/direction for both services would require a minimum of 720 Bertie Beetles operating Brisbane based on starting from 6 minute frequencies and 60 vehicles over 2 routes.
What happens when you want to “extend” them ‘Bertie Beetles’ to the Airport, Chermside, or [insert random location] that corresponds to [insert Olympic venue(s)]?
It would be cheaper to buy all of the chocolate produced in Switzerland than running a 700+ fleet of imported buses. Bertie Beetles made from Swiz chocolate and not local carob.
If a theoretical LRT conversion of the SEB occurred in isolation, then those ‘rocket’ services would be mostly redundant except for the ones that bypass the SEB. The Eagle St/Riverside services would use the Captain Cook Bridge which bypasses the Cultural Centre completely.
An LRT at peak-hour would be running at 5 to 6 minute frequencies at peak-hour, unless your connecting service is on the SEB to which you would need to transfer. Those services could share the corridor with LRT, for parts of or most of the journey until it turns off the SEB.
It about damn time they fully utilised the Captain Cook Bridge for more bus services which bypass the busway. We should be petitioning for a bus-only lane on the bridge with the volume of services that will be using it.
LRT Mode Doesn’t Have Enough Capacity
Also, the capacity is short. 60 min / 5 min frequencies = 12 trams/hr.
Say we have 4 or 5 car LRV consists with 750 pax each.
That is 12 x 750 pax = 9,000 pphd (or about half the current capacity of the SEB).
Consider: A better option is to consider going straight to rail-based metro or heavy rail.
Brisbane Metro Buses - What is required to accomodate 18,000 pphd all on Brisbane Metro BRT Vehicles?
18,000 pphd / 150 pax = 120 buses per hour.
What goes in must come out, so double this => 120 x 2 = 240 Brisbane Metro buses.
Current plans are a fleet of 60 BRT vehicles.
Increase required: 240 - 60 = 180 additional vehicles.
Estimated cost: $190 million for 60 vehicles is $3.16 million/vehicle (2019 figure). Source: Brisbane Metro - Wikipedia
Use RBA Inflation calculator to bring this to 2024 figures => About $3.81 million/vehicle (2024 dollars). Let’s just say $4 million each. Inflation Calculator | RBA
180 additional BRT vehicles x $4 million => $720 million ballpark figure.
Some additional land would need to be set aside for new bus depots or modification of existing ones to accomodate the vehicles.
Comparison with LRT
Gold Coast Light Rail Stage 3 in Priority B:
$1.2 billion, 6.7-kilometres => $179.1 millon/km
For SEB conversion on the same basis, for about 17 km:
17 km x 179.1 million/km = $3.04 billion.
(figure includes a short section into the Brisbane CBD, and does not include a new Victoria Bridge or busway platform lengthening works)
Relative comparison LRT/BRT on costs
$3.04 billion LRT / $0.72 billion BRT => LRT is 4.22x more expensive.
Conclusion
Note, I am not recommending or advocating this, just providing estimates of the figures discussed in this thread. If you disagree with the calculations, please consider setting out your own.
For about the same or less cost than 1 km of rail-based metro (Sydney Metro - $1 billion/km), most of the SEB peak hour buses could - in theory - be replaced with Brisbane Metro BRT vehicles and carry 18,000 pphd.
Estimates above suggest that Light Rail conversion would cost at minimum about 4x more than just buying more Brisbane Metro BRT vehicles to carry the same 18,000 pphd in peak hour. LRT would also require expensive infrastructure works (new Victoria Bridge, busway platform lengthening) ($$$)
Again, all of this suggests skipping LRT conversion and going straight to rail-based metro, or a parallel QR heavy rail train within the M3/M1 corridor. Other parts of Brisbane are better candidates for the LRT mode.
The LRT cost you use includes building a ROW but that already exists for busways. I suspect conversion cost is lower!
I am not sure LRT gets the capacity increase needed though!
I am intrigued why Bertie buses can be every 60 seconds (sorry I can’t see that physically working or being safe) but LRT or other is only every 5-6 minutes? Or am I miss reading this?
I think SEB just operating Bertie buses at crazy frequencies is not realistic (only works in paper) and stops any future expansion!
Agree LRT is suited for other routes but honestly so are Berties!
For it to be the same cost as BRT, the per km cost would have to be 4.22x lower than $179.1 million, or just $42 million/km.
It’s very optimistic.
Peak hour bus lanes on Gympie Road, for example, cost $172 million for 2.3 km or 74.7 million/km.
Notes
TMR project costings
Why did Ottawa go LRT instead of heavy rail or a metro/subway system when they converted their busway given their population is way larger then Brisbane’s?
The busways were designed to be converted to light rail. Grade A corridors (busway or rail lines) are cheaper per km and quicker to build on compared to normal roads.
Unlike a Bertie you can stack LRT’s together to easily increase capacity, unless you subscribe to my theory that they will be metro-pedes.
Nothing stopping a city having 1 minute LRT service except for physically having the trams, the drivers, and a place to store them; and the money.
Members are free to set out and provide their own calculations for theoretical capacity and estimated costs with the full working as I have.
The numbers I’ve arrived at don’t appear to stack up for light rail.
Heavy rail or metro rail would be a better fit, IMHO. I would support the inclusion of LRT conversion in any options study, if only to confirm the points made against it already.
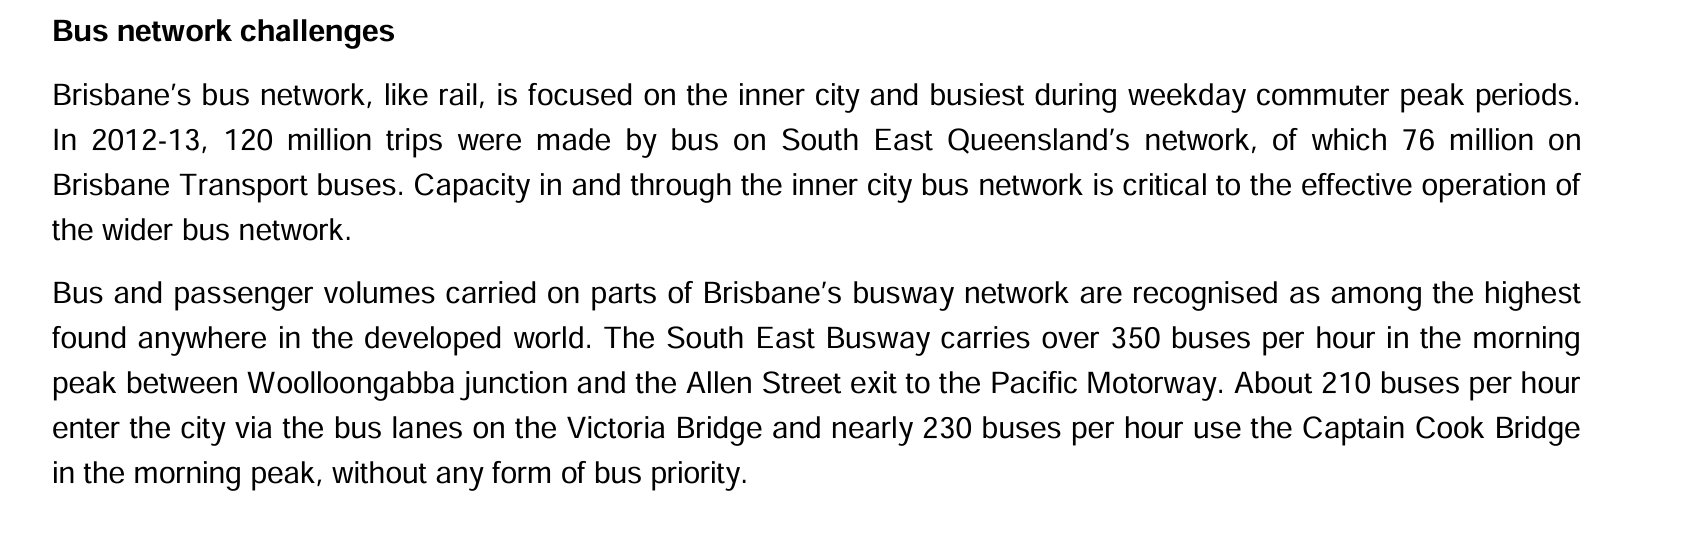
It’s not a garbage figure. 350 buses per hour (bph) inbound between the Woolloongabba wye and Allen St used to be the norm.
Even with a conservative seating of 41 for a rigid bus, that’s 14,350 seats per hour. Bring it up to even 60 people per bus (some buses will be bigger e.g. articulated bus can take 100 at crush capacity). That’s 21,000 people per hour. It could be higher depending on how many buses are larger 14.5m or articulated buses.
Presenting research/evidence can help support a view. Some research:
SEB Bus Capacity - Current
Ottawa OLRT (busway conversion to LRT)
The Confederation Line of the OLRT System is a 12.5-km east-west Light Rail Transit Project through the heart of Canada’s national capital. The project will replace, enhance and extend the existing Bus Rapid Transit service corridor, and will serve over 9 million passengers annually.
The project includes 13 new stations, 2.5-km of twin tunnels (with 3 of the 13 stations located underground through Ottawa’s downtown business core), and possessed a capital construction of cost of nearly $2.1 Bn (Cdn).
Length = 12.5 km
Cost = CAD $2.1 billion (doesn’t tell us the exact year, could be 2013)
Exchange Rate: 1 CAD = 1.12 AUD (Aug 2025)
AUD 2.35 billion / $12.5 km = $188 million/km.
(we would need to adjust this figure upwards for 2025 today’s dollars)
The Ottawa LRT project includes underground stations. With a BRT network, buses can be dispersed among multiple CBD streets or corridors (e.g. Adelaide St, QSBS, Elizabeth Street).
With LRT, the line is coming into the CBD packed and will likely be going down one corridor before dropping off its passengers. The huge volume of passengers means that the ideal case is underground CBD stations ($$$).
Cities that generally start with LRT on the surface tend to put LRT underground when patronage grows for this reason.
Scenario: SEB Busway Conversion to LRT like Ottawa, Canada:
Applying the above Canadian figures for busway to LRT conversion to the SEB:
17 km x $188 million km = $3.19 billion.
This is very close to the $3.04 billion we estimated using the GCLRT method. The two estimated figures are within 5% of each other.
Comments
Even using a scenario where LRT is laid into a Priority A corridor, the calculations return essentially the same result.
Notes
BAT Tunnel Initial Advice Statement
Ottawa Light Rail, Canada
But it’s not representative of the capacity of the busway network, rather it is representative of only a very specific point where two ‘branches’ of the network overlap, where no services stop because there are no stations. The 18,000pphpd was based on a bus every 12 seconds (300hr) with 60 passengers on board. You cannot maintain a 12 second ‘headway’ down the broader busway network where buses have to make frequent stops, whether that bus carries 24 or 120 people. It is only getting its capacity by not servicing locations.
But to the point of the thread - I don’t think we should be replacing the busway. It does what it does reasonably well. I think we should look at where these 60% of services are coming from (I assume its beyond Carindale and Upper Mt Gravatt) and work out if there is a separate solution that can move these people without using ~200 vehicles per hour.
Adit: I’ve placed headway and branches in quotes to reflect I’m not using those terms in a technically correct way, not for any emphasis or the implication that they’re foreign concepts.
Ottawa is a smaller city than Brisbane with less density. Their first light rail line was a success but later lines have been heavily criticised. Overall the ridership is around 20 million so lower than either our trains or our busway and lower per KM than G:link.
So overall not the best comparison. Vancouver is closer in population and upgraded their busiest bus corridor with an expansion of their Automated light metro.
The Confederation Line is apparently classed as a ‘light metro’ service.
CoPilot had an interesting answer to the question of 18 fully loaded buses vs Vancouver’s Mark 5 Sky Train loading on bridge.
Based on the latest specifications from Alstom, the Vancouver SkyTrain Mark V is a five-car automated light metro train with a passenger capacity of 672 people
While the exact weight isn’t listed in the public release, we can estimate it based on similar light metro vehicles.
Estimated Weight of Mark V SkyTrain
- Typical weight per car: ~40–50 tonnes
- Total for 5 cars: 5×40–50 = 200–250tonnes
Weight of 20 Fully Loaded Buses
- Typical weight per bus: ~18–20 tonnes
- Total for 18 buses: >18×18–20=324–360 tonnes
Conclusion
Yes, 18 fully loaded buses would place more total load on a bridge than a single Mark V SkyTrain, by a margin of roughly 100–200 tonnes. However:
- The SkyTrain distributes its weight more evenly across many axles and rails.
- Buses concentrate their load on fewer axles, which can result in higher point loads.
So while the total mass of the buses is greater, the impact on the bridge structure depends on how the bridge is designed to handle concentrated vs. distributed loads.
Makes you wonder if the LRT or Metro can’t run over Victori bridge is an apples to apples comparison.
One element Co-Pilot didn’t account for was the added weight of the infrastructure needed to run light rail across the bridge.
Probably worth noting too that the Victoria Bridge did undergo strengthening works as part of the reconfiguring from a mixed traffic bridge:
The Victoria Bridge has been a key crossing of the Brisbane River for public transport, private vehicles and pedestrians/cyclists since its opening in 1969. As part of the Brisbane Metro project, the structure was closed to general traffic in January 2021 to prioritise public and active transport by increasing the busway corridor and adding a dedicated cycleway to the bridge.
In order to accommodate the expanded busway and the increased vehicle mass from the electric vehicles, the 50-year-old post-tensioned precast box-girder bridge was assessed for strength and was found to have flexural and shear deficiencies in isolated locations on the approach spans as well as local weaknesses at the halving joints at mid-span.
The bridge structure presented numerous constraints including a dense array of utility services housed within the bridge, the presence of previous bridge modifications, maintaining traffic on the structure for the duration of the works and an aesthetic requirement to maintain is current elegant appearance within its prominent inner-city location. A unique strengthening design was developed which recognised these constraints while ensuring constructable detailing of the works.
The strengthening design developed incorporates flexural strengthening using external post-tensioning directly fixed to the webs of the bridge using an ultra-high-performance fibre-reinforced concrete (UHPFCR) blister. Shear strengthening of box-girder webs using prestressed hot-rolled bars was also designed along with a carbon fibre reinforced polymer (CFRP) strengthening solution at the half joints. The works also utilise near surface mounted (NSM) stainless steel reinforcement to provide additional strength where thickening of sections is not possible.
This presentation shall provides an initial overview of the bridge refurbishment along with the key areas of the strengthening works. It also describes how the design and detailing was carefully planned in order to ensure effectiveness while minimising the risk of damage during installation.
I don’t have any numbers for this unfortunately, but I’m friends with one of the civil engineers who designed the (cancelled!) shade structure that was meant to be installed on the bridge with the metro works. He way saying the Victoria bridge is unusual in that it’s actually got quite a low maximum weight capacity - allegedly the original architect wanted it to look as thin as possible. From memory it was designed for something like 80% utilisation which is apparently very rare for a road bridge. I’d imagine the extra infrastructure from fixed rail would probably be too much without further strengthening.
Agree the calculation needs to include removal of the asphalt replaced with sleepers and rail + safety structure.
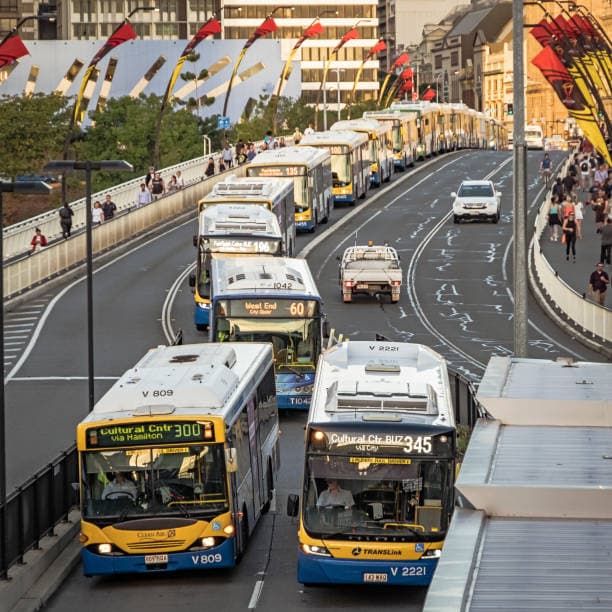
Can’t comment on the 80% but there were plenty of times the bridge was full of buses both directions and I didn’t see anyone jumping up and down about an imminent collapse.
So the bridge must be able to safely carry the weight of full buses across the full span with enough safety margin to not worry anyone.
I think Chat GPT has thrown you a curveball. Assuming those weights per vehicle are correct, that means the LRT has 10t axles (20t bogies, assuming there are no Jacobs bogies). So the same weight as each bus, applied to a single location.
The end-to-end busses would more evenly distributed load, whereas the LRT has higher point loads.
The LRT also pays a penalty for dynamic effects (trains don’t have suspension likes busses do). And on top of that you have the extra weight of the slabtrack.
And on top of all that, 18x busses would be longer than the LRT. So the load is spread over a longer area, and not all loading the same/adjacent area(s).
I guess my point is that the weight of fully loaded (80%) and stationary buses on the bridge is not a single concern ever yet a controllable single vehicle with weight spread by rails and sleepers (which weight about the same as the asphalt it would replace) that is very unlikely to stop on the bridge is a hard and fast No.
Just seems too convenient an answer.
It’s the same answer whenever an alternative to a bus is considered.
Can’t work!
Many members would like to see LRT return to Brisbane. However, the Light Rail mode does not seem a good fit for this specific use case. (It may be a good fit elsewhere in Brisbane).
Non-Bus modes
An example of a non-bus mode here would be using the CRR tunnels and heavy rail.
By placing Gold Coast and Beenleigh trains into the M1/M3 corridor (not on the busway itself though) you don’t need to build another river crossing or underground CBD stations. You just use the existing, brand new CRR stations. Perth already has this sort of motorway railway setup for many lines.
It will also speed up the GC and Beenleigh lines and would be integrated with the rest of the rail network from Day 1.
You can add say 10 new trains to a 1-hour peak inbound, and extend the trains to 9-car if you need more peak capacity.
That would give a capacity uplift similar to a new busway.
Engineering Report
There have been many investigations for Light Rail crossing the Victoria Bridge. The prior Victoria Bridge did support trams but the latest version (built 1969) did not as the tram network had just been shut down.
The following report can be found in the State Library of Queensland. It assesses the capacity of the Victoria Bridge to handle Light Rail ( though not sure if 4xLRV consists with 750 pax onboard was assessed).
Report on Victoria Bridge light rail investigation / Nick Stevens Consulting
Nick Stevens Consulting
<Queensland : Nick Stevens Consulting; 1998>