Now available.
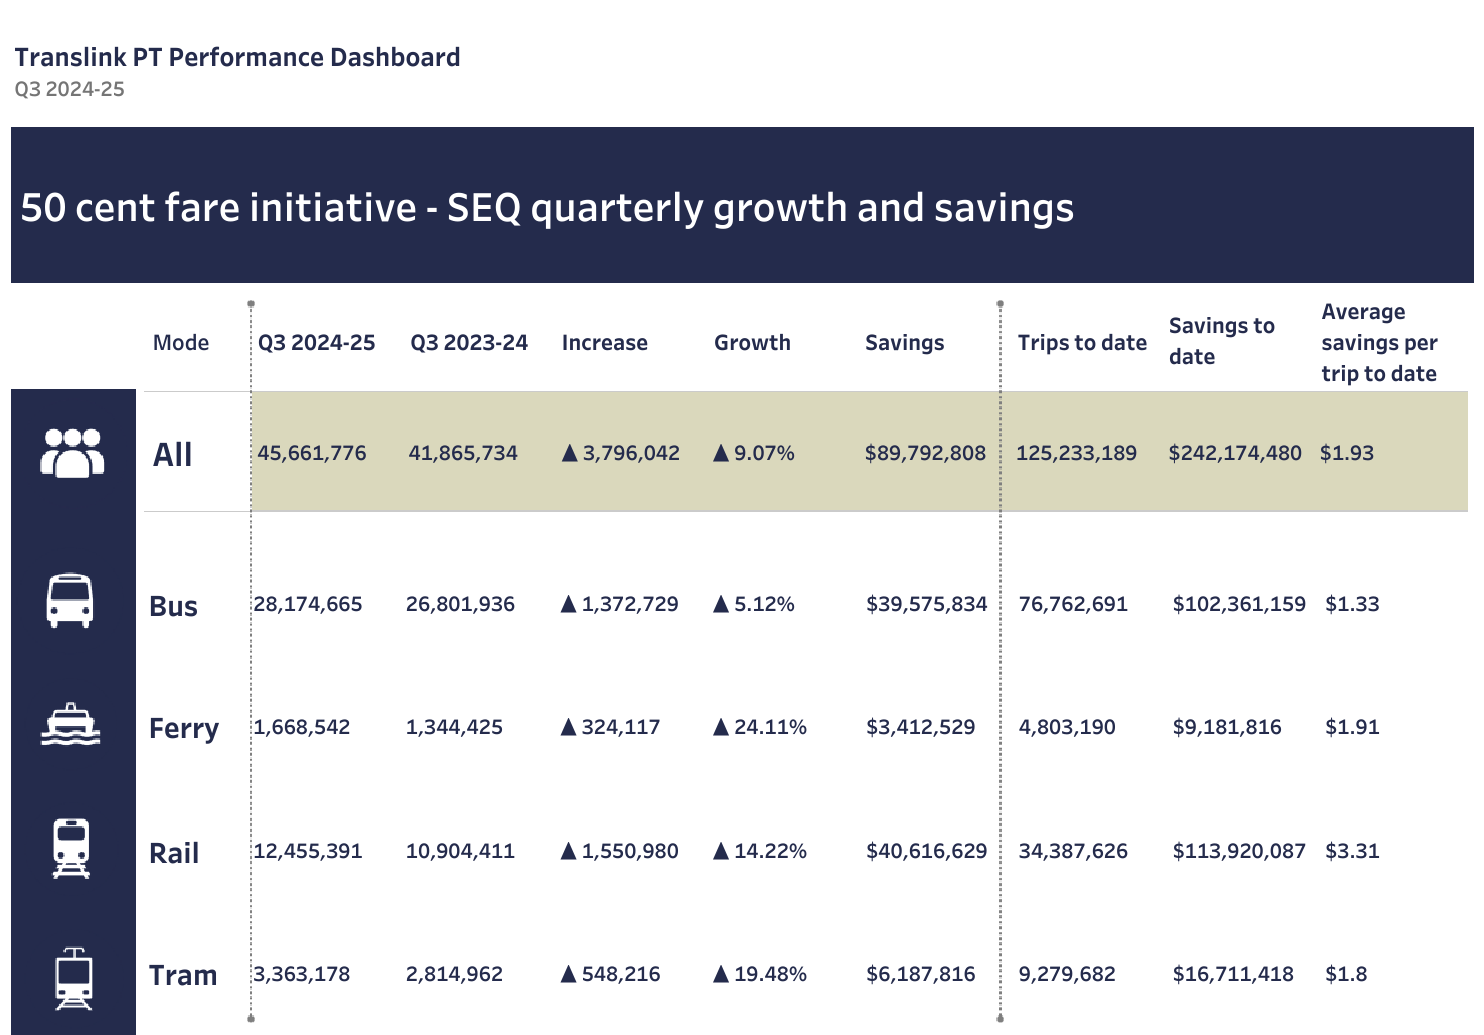
Overall patronage growth compared to Q3 2023-24 is +9.07%.
Bus +5.12%
Ferry +24.11%
Rail +14.22%
Tram +19.48%
2 Likes
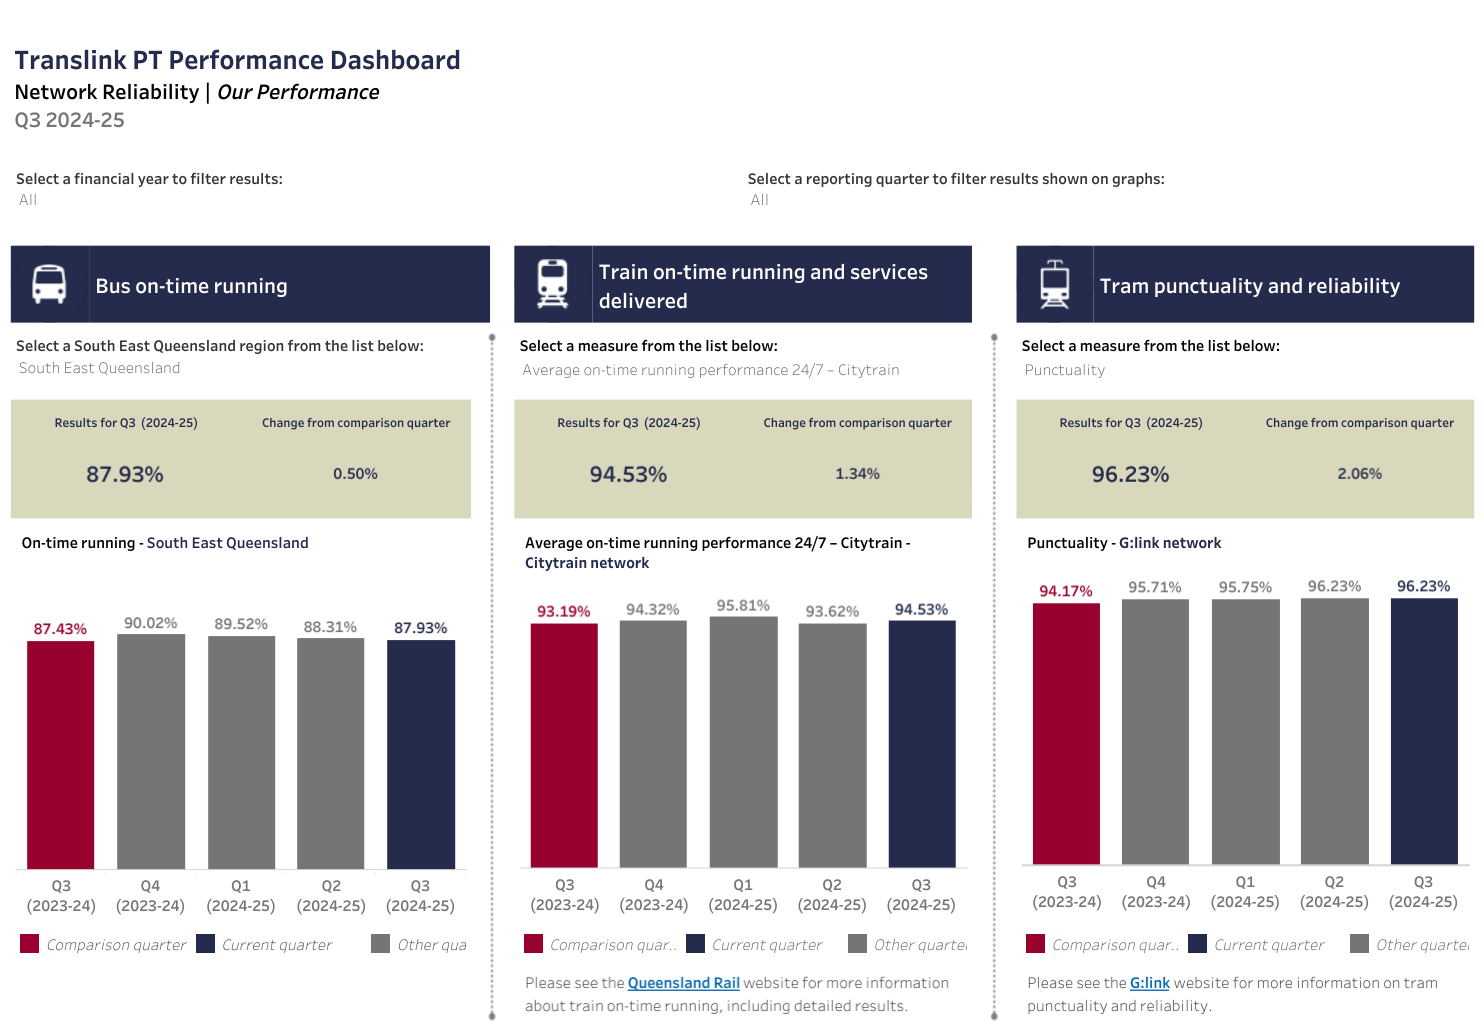
I can definitely believe this: trams have been getting quite full over the past few months and I’m not particularly sure if a frequency increase (from 7.5 to 6 minutes) could be possible with the current amount of sets (23 as of right now) after the extension to Burleigh opens.
2 Likes
The patronage seems to have dwindled from Q2 to Q3, I wonder if the low quality of service is deterring users away from PT as time progresses from the 50c introduction.
Ignoring the 5 newest trams acquired for the extension - with 18 trams they can reliably run 6-7 minute headways from Helensvale to Broadbeach with all but 2 on the road. I haven’t sat down and done the maths properly but assume they probably need about another 5-6 to bump the headway to every 6 minutes on a daily basis - fewer if they just want to be able to run a more intensive service when there are special events on.
Best to compare the same quarter. Comparison of Q3 to Q2 is a bit misleading due to Q3 covering January February and March. January is a light month due to holidays etc.
4 Likes
Encouraging growth on all modes, although so much more potential, particularly on rail.
3 Likes